We surveyed more than 400 data professionals about their main day-to-day challenges and how they see automated tools for metadata management shaping the future of BI & Analytics.
Download the survey report to find out: what data consumers are really spending their time on and why they are so frustrated, the challenges of building a business glossary, and how to get started with an automated business glossary and why it’s critical for BI intelligence.
Executive Summary
A business glossary is the glue that binds an enterprise’s operations together.
It is not possible to do business well without successfully putting business intelligence (BI) to work in an organization. Flying by the seat of your pants when it comes to analyzing the market, internal performance, or competitor performance just doesn’t work. Successfully putting BI to work takes a strong foundation, and a business glossary is meant to help everyone speak the same business language across the enterprise. That extends from BI teams to business analysts, data analysts, data scientists, and data governance managers.
A business glossary is a central element of effective data governance. There’s no easy way to build and automate data lineage without it, nor is there any way to effectively support automated metadata-driven discovery to find data and leverage it fast without a business glossary.
And yet, almost 50 percent of the executives and BI managers who responded to the survey for this report are not satisfied with their current data lineage capabilities.
To productively deal with new types of data, huge volumes of data, and new ways to view it, a business glossary is a key organizational platform. You can’t risk falling behind competitors who have a better handle on their internal data term definitions and thus their BI and data governance efforts.

Survey on Automated Business Glossaries
DATAVERSITY® partnered with Octopai in early 2020 to survey business technology professionals in multiple roles at organizations of various sizes across 30-plus industries about their business glossaries and the role automation can play in vastly improving their business intelligence.
The survey had eighteen questions, including three general demographics questions. Respondents were recruited primarily through a marketing email campaign. They received links to The 2020 Business Glossary Automation Survey and did not have a time limit answering the questions. No compensation was given for participation. The results and conclusions contained within this paper are representative of the survey respondents only.
Most of the 293 survey respondents are in data information/data governance roles (44 percent) and data and/or information architecture roles (23 percent). BI and/or analytics represented the next largest group of respondents (8 percent), followed closely by executive management (6 percent) and IT management (4 percent). Other roles include application developers, database administrators, data scientists, strategic technology planners, technology or scientific researchers, and software or system vendors (each under 2 percent).
Among the represented industries, finance, government, healthcare, banking, insurance, and technology are the most represented at around 10 percent each.
One-quarter of respondents work in businesses with 1,001 to 5,000 employees. Companies with 10,001 to 50,000 employees came in second at 18 percent. And businesses with 101 to 1,000 employees came in third with 17 percent. However, all ranges of business size were represented in the survey, with the smallest portion being businesses of 11 to 100 employees at 8 percent.

What is a Business Glossary?
Almost 50 percent of the executives and BI managers who responded to the survey for this report are not satisfied with their current data lineage capabilities.
To put it simply, a business glossary is the cornerstone of TRUSTWORTHY data to inform accurate business intelligence. It is the source of truth on the business’s metadata, and as Gartner has said, “the semantic foundation for logical data warehouses and business analytics.”
A business glossary should be the result of an enterprise-wide collaboration so that each business department can then effectively collaborate with each other.
When a business has many different definitions and usages across diverse groups and systems for the same business term, problems occur. BI reports may be inconsistent and even contradictory. When these issues arise, business decisions are delayed – and business opportunities possibly lost.
A business glossary combats that chaos by enabling consistency in data assets, reports, and dashboards. Also, a common understanding of business terms makes it easier to generate, sustain, and integrate new sources of data in the environment. The standardization that a business glossary provides makes it easy for data professionals to make the connections needed between data elements with the same meaning but different names when developing new reports and dashboards.

Automation is the Number One Need
More than three-quarters of respondents say that the automation of metadata operations, including data lineage, has a high degree of importance to their team’s success [Figure 1].
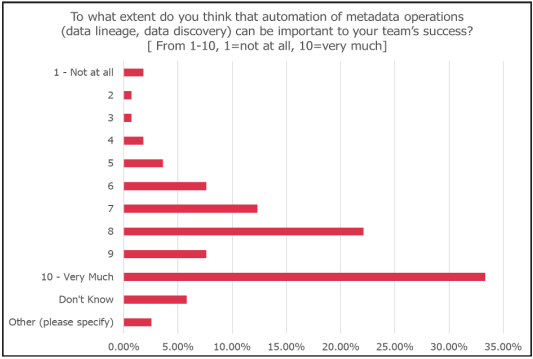
68 percent of respondents said the automation of metadata operations was important (a score of 8 or higher) to their team’s success. This is because it takes so long to work on the specific tasks shown in Figures 2 and 3, and these use cases are occurring 40-400 times per month, so automation becomes critical. Automation becomes even more important as many mid-size enterprises have several BI departments, and every person in each BI team has to spend days or weeks on each task.
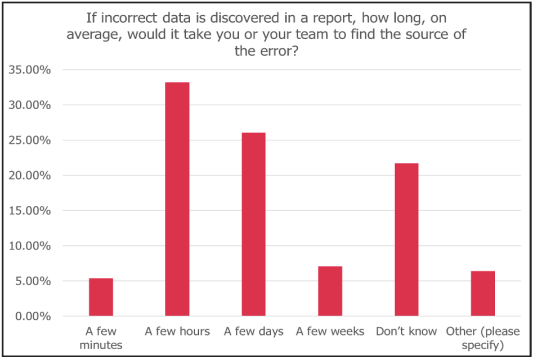
Close to 50 percent of BI/analytics respondents said it takes them a minimum of a few hours to find the source of incorrect data, while 45 percent said it can take at least a few days.
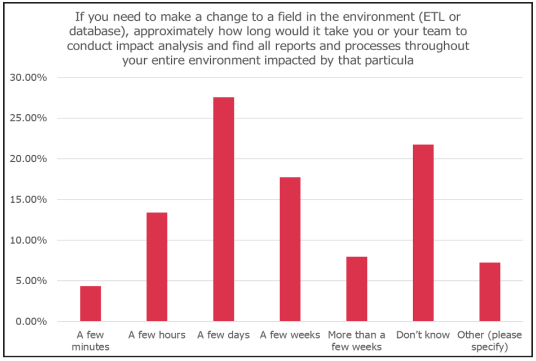
62 percent of data and/or information architecture respondents said it would take them a few hours to a few weeks to conduct impact analysis (finding all reports and processes throughout the entire environment impacted by a particular field requiring a change).
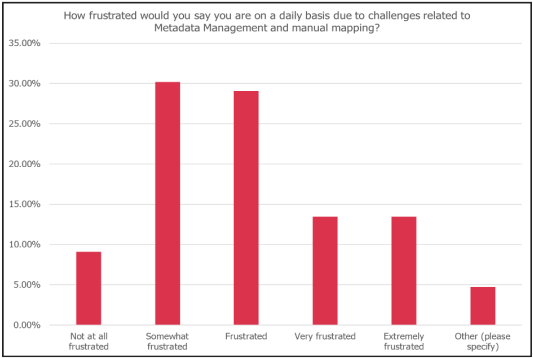
More than 85 percent of information/data governance respondents said they were “somewhat to extremely frustrated” on a daily basis due to challenges related to metadata management and manual mapping [Figure 4].
Failures with the Traditional Approach
Close to 50 percent of BI/analytics respondents said it takes them a minimum of a few hours to find the source of incorrect data, while 45 percent said it can take at least a few days.
Though a business glossary should be a central source to assist in business growth, historically, implementation has been burdensome, and companies often tire of funding these projects since they had to manually develop and control business glossaries – without automation.
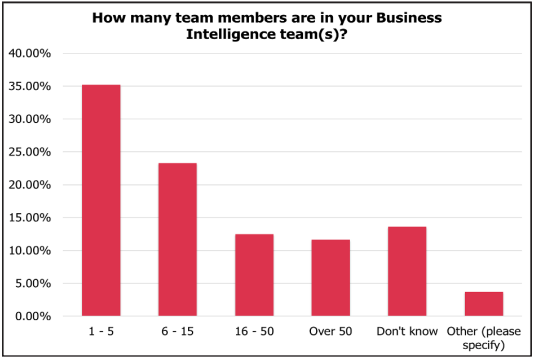
That is a labor-intensive project for a BI team to get underway, never-minding the time and energy it takes to maintain an accurate, up-to-date, and synchronized glossary. The problem of manually creating and maintaining a business glossary is compounded in enterprises that have multiple BI units serving their different brands. According to the survey, most of the represented BI teams had between six and fifty or more team members [Figure 5].
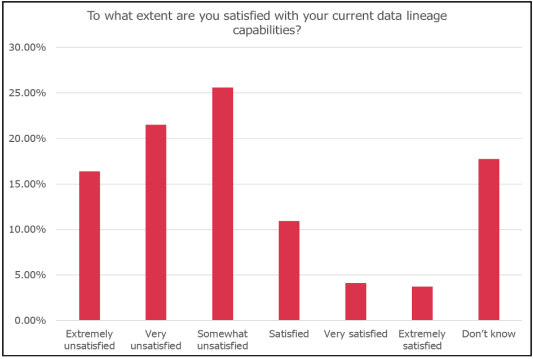
From the responses, concerns with regard to tracing data lineage from source to target – through its movement across the BI and analytics environment (ETL, databases, analysis tools, and reporting) – are evident. Only 20 percent of respondents [Figure 6] express some degree of satisfaction with these capabilities, which are meant to improve the understanding of data across its journeys. Most unsatisfied by far are respondents in information/ data governance roles (40 percent) followed by those in data/information architecture (32 percent). That may be because data governance pros, in particular, have the highest expectations for data lineage performance to support the ongoing improvement of the activity.
More than three-quarters of respondents say that the automation of metadata operations, including data lineage, has a high degree of importance to their team’s success [from Figure 1].
Business Glossary Struggles Abound
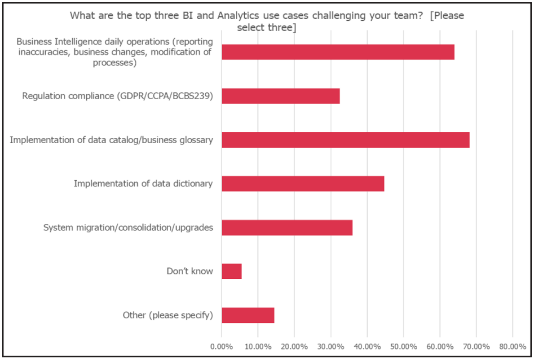
One of the two most challenging BI and analytics use cases that teams face is the actual implementation of a business glossary (68 percent). Respondents in data/information architecture (22 percent) and information/data governance (47 percent) roles were the most likely to cite this as a challenging issue. That makes sense, as data/information architects must create a ranking system for data categories with the terms to make it seamless for business users to browse information, and employees charged with information/data governance are concerned they won’t be able to adequately serve their business customers without a robust business glossary, as shown in Figure 2.
Responses from survey-takers highlight the challenges surrounding proper business glossary implementation. One respondent cited complications arising from “the creation of data silos,” and another was frustrated with the problems of “defining the proper internal data and how to start to collect missing data sets within the business.”
The second biggest challenge that BI and analytics teams face, according to the survey, is managing business intelligence daily operations (64 percent). Again, respondents in data/information architecture roles (22 percent) and information/data governance roles (47 percent) were the most likely to cite this as a challenging issue, reflecting the concern about potentially breeding a lack of trust in existing content for use in analytics, as one survey-taker noted.
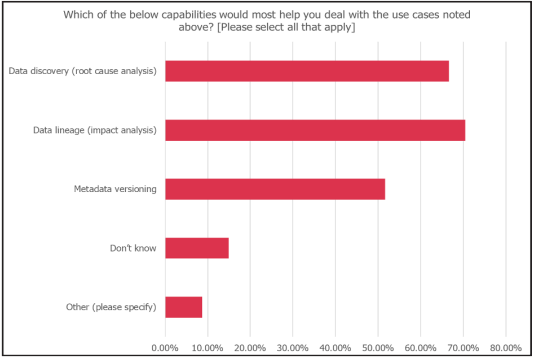
Data lineage for impact analysis (70 percent) and data discovery for root cause analysis (67 percent) are the most likely to help manage BI and analytics use cases [Figure 3]. Metadata versioning (52 percent) ranked close behind the first two. One survey-taker noted the importance of metadata management approval workflows. Two others spoke to the same complications that circle around metadata versioning: metadata collection and completion. One summed things up with the comment that “having metadata, period” was a main problem.

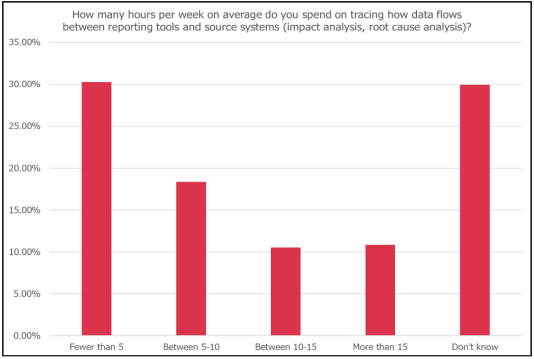
As it stands now, more than one-third of respondents report they spend between 5 and 15+ hours on impact and root cause analysis [Figure 7]. The most burdened with this task are application developers – 20 percent put more than 15 hours per week into the job. And 100 percent of database administrators spend between 10 and 15 hours on this.
One might conclude that the trouble lies in manual and ineffective data lineage and discovery methods – they feed these problems because it becomes difficult to trace data through to the correct source and through the lifecycle to find patterns across multiple sources.
One-third of respondents [Figure 8] – the majority of them data scientists – say it can take hours to find the source of incorrect data in reports, and over 25 percent – the majority BI/analytics professionals – go so far as to say it can take days.
Today, using manual processes means that success is not always being realized – 55 percent of respondents are frustrated, very frustrated, or extremely frustrated.
When changing a field in an ETL or database environment is necessary, 45 percent report they would spend anywhere from a few days – primarily database administrators and BI/analytics pros – to a few weeks – primarily data/information architecture, information/data governance, and executive managers – to find all the reports and processes throughout their environments that were impacted by the error, as shown in Figure 9.
Each multi-person BI team likely will face these issues at one time or another, aggravating the problem throughout the entire enterprise. When data in reports is conflicting, each group will find itself manually culling through the data, item by item, and manually reverse-engineering how each report was created. That’s a starting point, but each team will still have much to do in order to identify any further errors and correct the dataset.

Advantages of an Automated, Cross-Platform Business Glossary
One of the two most challenging BI and analytics use cases that teams face is the actual implementation of a business glossary at 68 percent.
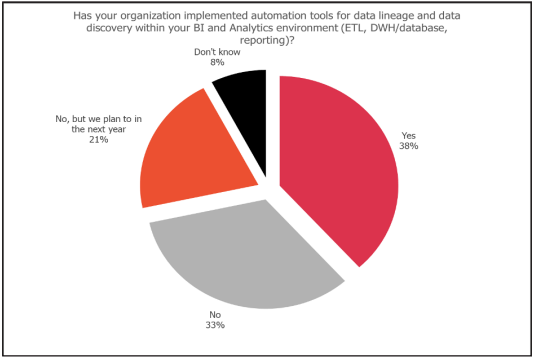
While the majority of respondents are convinced that data lineage for impact analysis will help with these problems, a total of 63 percent are somewhat, very, or extremely unsatisfied with their current approach to data lineage, as previously shown in Figure 6. That figure significantly outweighs the barely one-fifth of respondents who are currently satisfied. And that is the case even though many respondents – close to 40 percent –have already made the move to automating data lineage and data discovery [Figure 10].
Something doesn’t add up here.
Perhaps so many organizations are experiencing problems because they lack a completely automated metadata platform – an automated business glossary, data lineage, and discovery all-in-one.
Organizations that follow this approach will be in better shape to realize greater value from their business glossary.
Automation of business glossaries makes it so that metadata terms are immediately captured and synched through the entire BI landscape, from data source to information delivery and consumption. There are no worries about manual entry errors when the glossary is generated automatically from the metadata. That has positive implications for data lineage and data discovery. Data is TRUSTWORTHY, which spurs greater user engagement with data via BI solutions including self-service BI.
In that respect, the automated business glossary is the tool for competitive advantage. Business users and decision-makers are more at ease with using a BI solution that lets them trust the decisions they make through data analysis. Survey findings confirm this. As noted above, a majority of respondents (62 percent) say the automation of metadata operations is highly important to their team’s success. Today, using manual processes means that success is not always being realized – 55 percent are frustrated, very frustrated, or extremely frustrated.
Equally notable, an automated business glossary is the backbone of data governance. Without strong governance programs, organizations are at risk of violating compliance regulations such as GDPR and CCPA. A governance program can’t be strong when there is data ambiguity and no ability to collaborate on compliance projects or assure the audit trail that data lineage is designed to enable.
Without automation, users are trapped in the unscalable and manual, time-consuming cycle of finding and fixing data errors – a problem that is multiplied by what are likely many multi-person BI teams that will confront the issue in different ways. Data lineage issues again manifest here. As referred to above, 63 percent are somewhat, very, or extremely unsatisfied on this point.
With automation comes the centralization and standardization of data layers (physical, semantic, and presentation) from all reporting systems, so terms among them are all the same, or at least connected to the glossary.
Automation also helps with the task of migrating data to the cloud, which most companies are doing today. The ability to include all the functions that are enabled by an automated business glossary matters as much there as on-premise. Nearly 40 percent of users cite system migration as a challenging use case.
What to Look for in a Solution
As businesses contemplate automating their business glossaries, they should consider the robustness of a solution’s capabilities to deliver benefits like those mentioned above. Some questions to think about:
- Is the product a completely automated metadata platform? Does the vendor package together automated business glossary, data lineage, and data discovery capabilities — which are all interconnected? Knowing your data from multiple angles drives improved decisions on how to use it.
- Is the business glossary adept at automatically storing and managing metadata in a central repository to enable the sharing and reuse of data sets, data definitions, metadata, and master data?
- Does it leverage cutting-edge technologies (such as machine learning) in its algorithms to define the dependencies between the various information systems it connects to in order to create that centralized metadata repository?
- Does it take all the descriptions from reporting tools (from the semantic/ logic layers) and correlate logical columns to physical columns to improve accuracy and streamline the implementation of an automated business glossary?
- Is its interface simple for business users, allowing for the easy comparison of reports, illustrating the differences between them, and showing how/why those differences occurred? Is there other ease-of-use support, such as visual mapping tools, to create a full data lineage across multiple systems?
- Is its platform cloud-based with fast implementation, simple tagging, and search for easy startup and maintenance?
- Is it an SaaS, cross-platform, metadata management tool rather than a limited, vendor-specific metadata management tool?

Conclusion
Companies are increasingly seeing the value of automated business glossaries for company-wide consistency and data integrity, and they want a quick and smart way for their BI and analytics teams to build such glossaries. They want better tools for keeping up with new data assets and making changes to existing assets.
BI team members were hired to derive insights for the business, after all, not conduct the tedious tasks that come with trying to manually implement a business glossary. And business users must be able to have confidence in the data that informs their work, not trepidation that data assets, reports, and dashboards are filled with errors and do not accurately represent their data.
A business’s success depends heavily upon a company-wide understanding of business terms so that it can finally understand how to properly use the data in its reporting systems, as well as govern it. It’s time to take advantage of automated business glossaries so that your business can finally have full visibility and control over your data and how it is managed by your organization.